Flight Path Analyzer
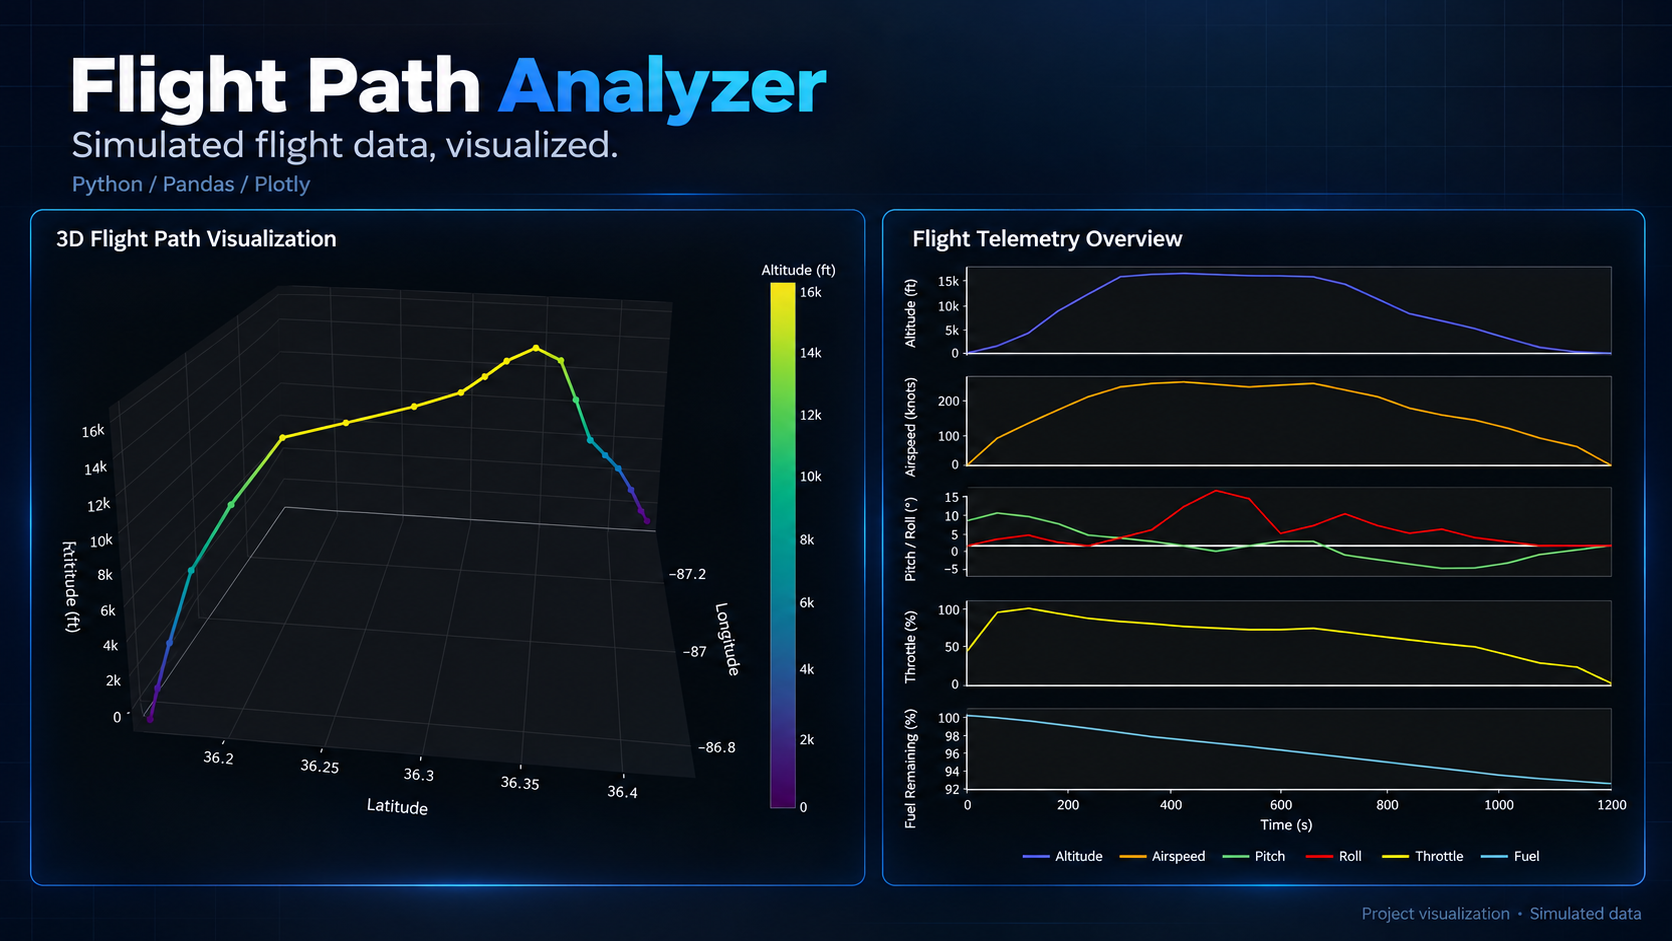
From simulated flight telemetry to an interactive 3D flight path and a dashboard of aircraft performance.
The purpose
Make simulated aircraft telemetry easier to inspect through a trajectory view and coordinated charts.
My contribution
Built an interactive visualization tool to process flight datasets and explore trends through graphical rendering.
How it works
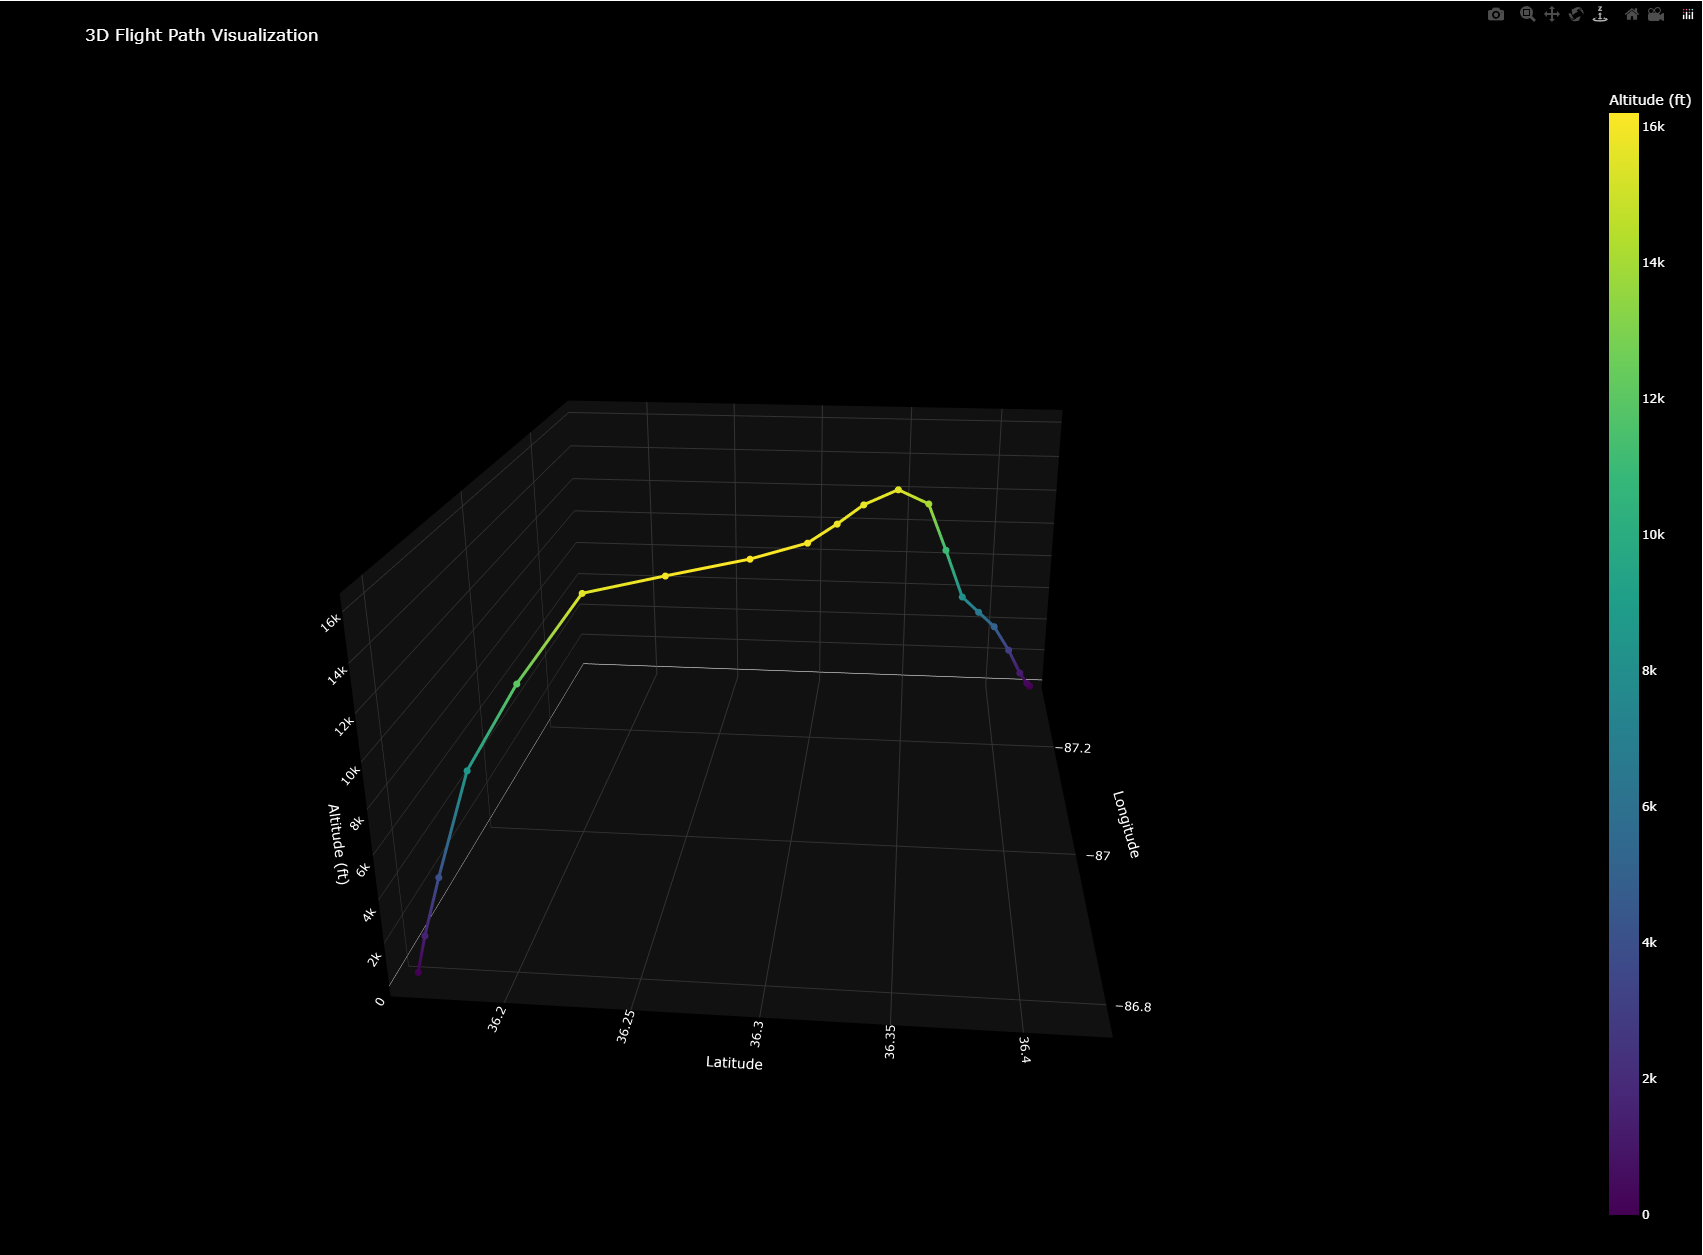
Loads JSON into a Pandas DataFrame. Plotly maps longitude, latitude, and altitude into a 3D trajectory, colors the path by altitude, and marks takeoff and landing. Separate charts show altitude, airspeed, pitch, roll, throttle, and fuel.
A challenge & the approach
Moving beyond a single script meant handling incomplete inputs before charting. The current package separates loading, validation, and visualization; required-field checks report missing columns, while loader error handling covers missing files and malformed JSON.
Project status
Installable Python package with a command-line entry point and pytest coverage for loading and validation. Uses simulated flight data; no hosted demo.